There’s no single view of right now
Your team walks the floor, checks gauges, opens ten different systems. Nothing shows what’s actually happening across the whole operation at once.
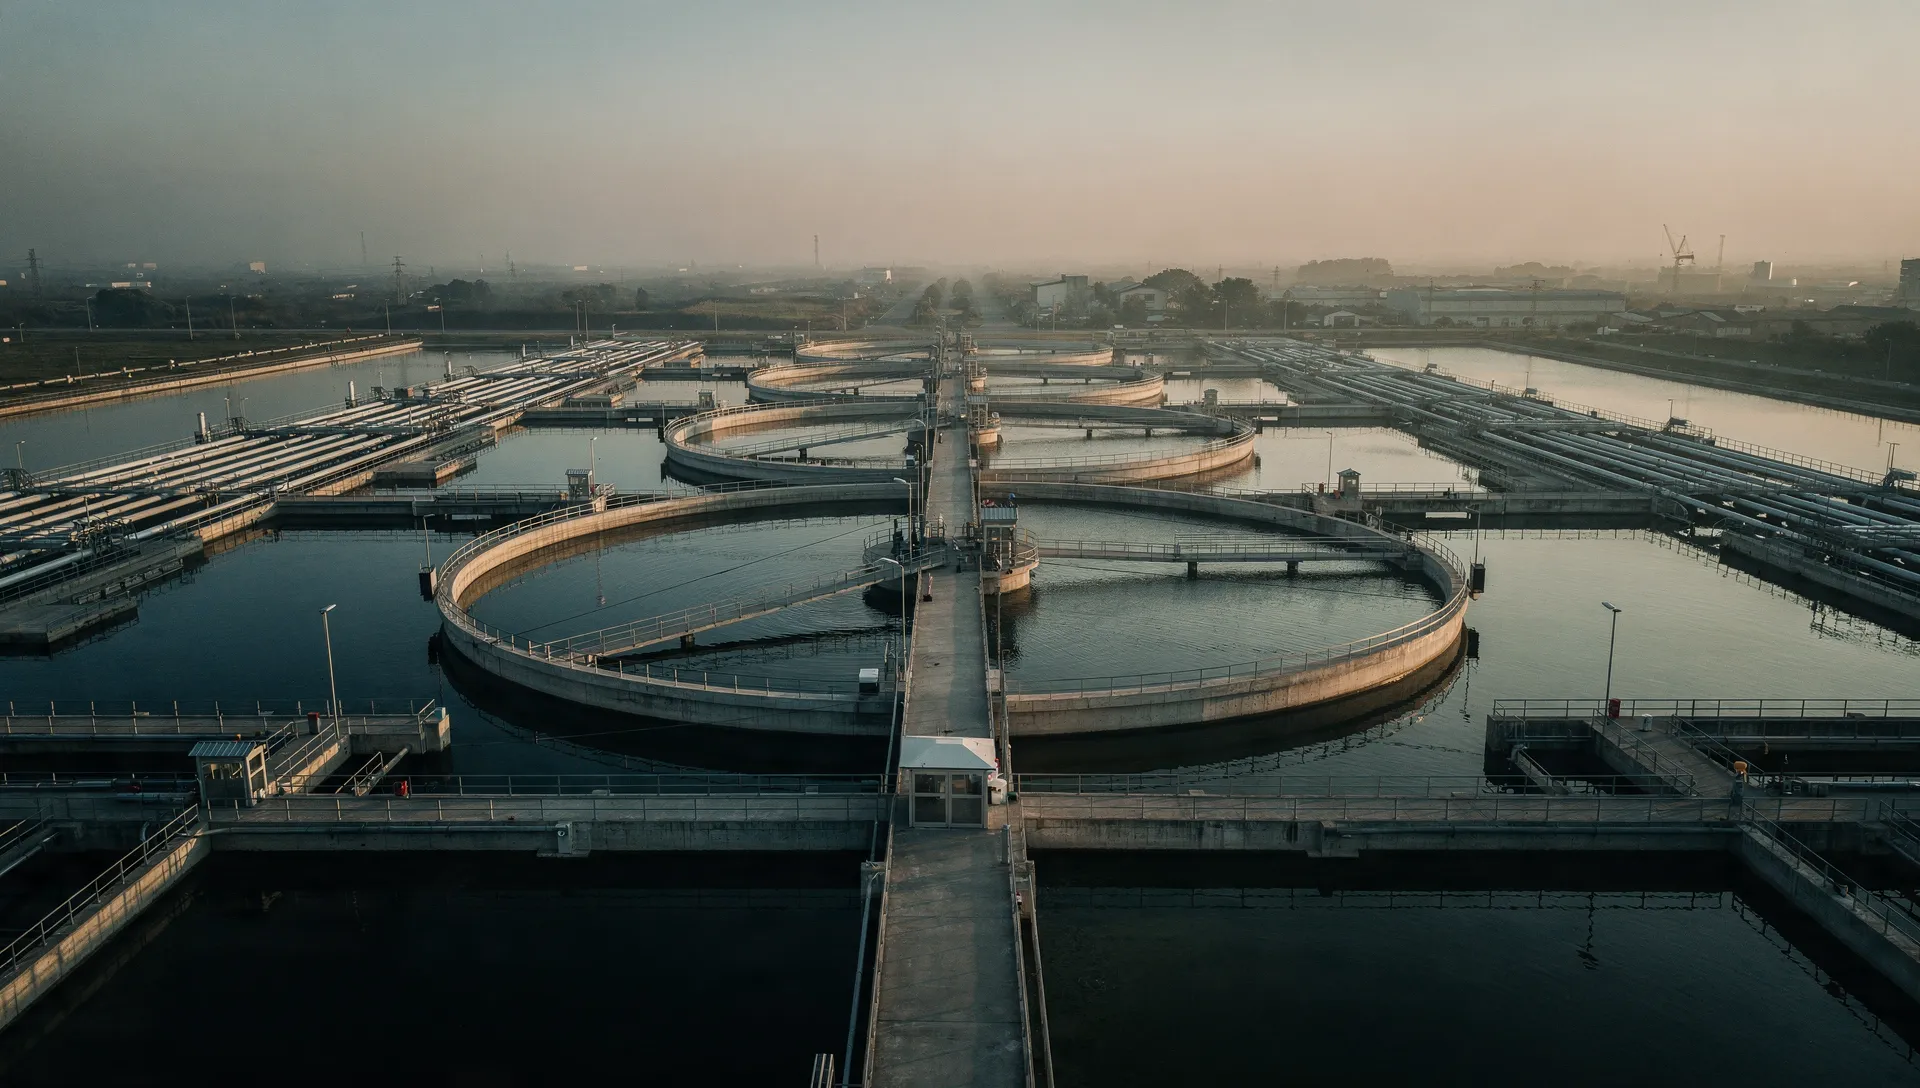
Built for mid-sized & small businesses
Draw it, connect your live data, and watch it update in real time.
What is VisualThings™?
VisualThings™ is industry-agnostic software to visualize, monitor and event-drive the control of your operational processes and objects in real time — the foundation for Operational Intelligence across your organization.
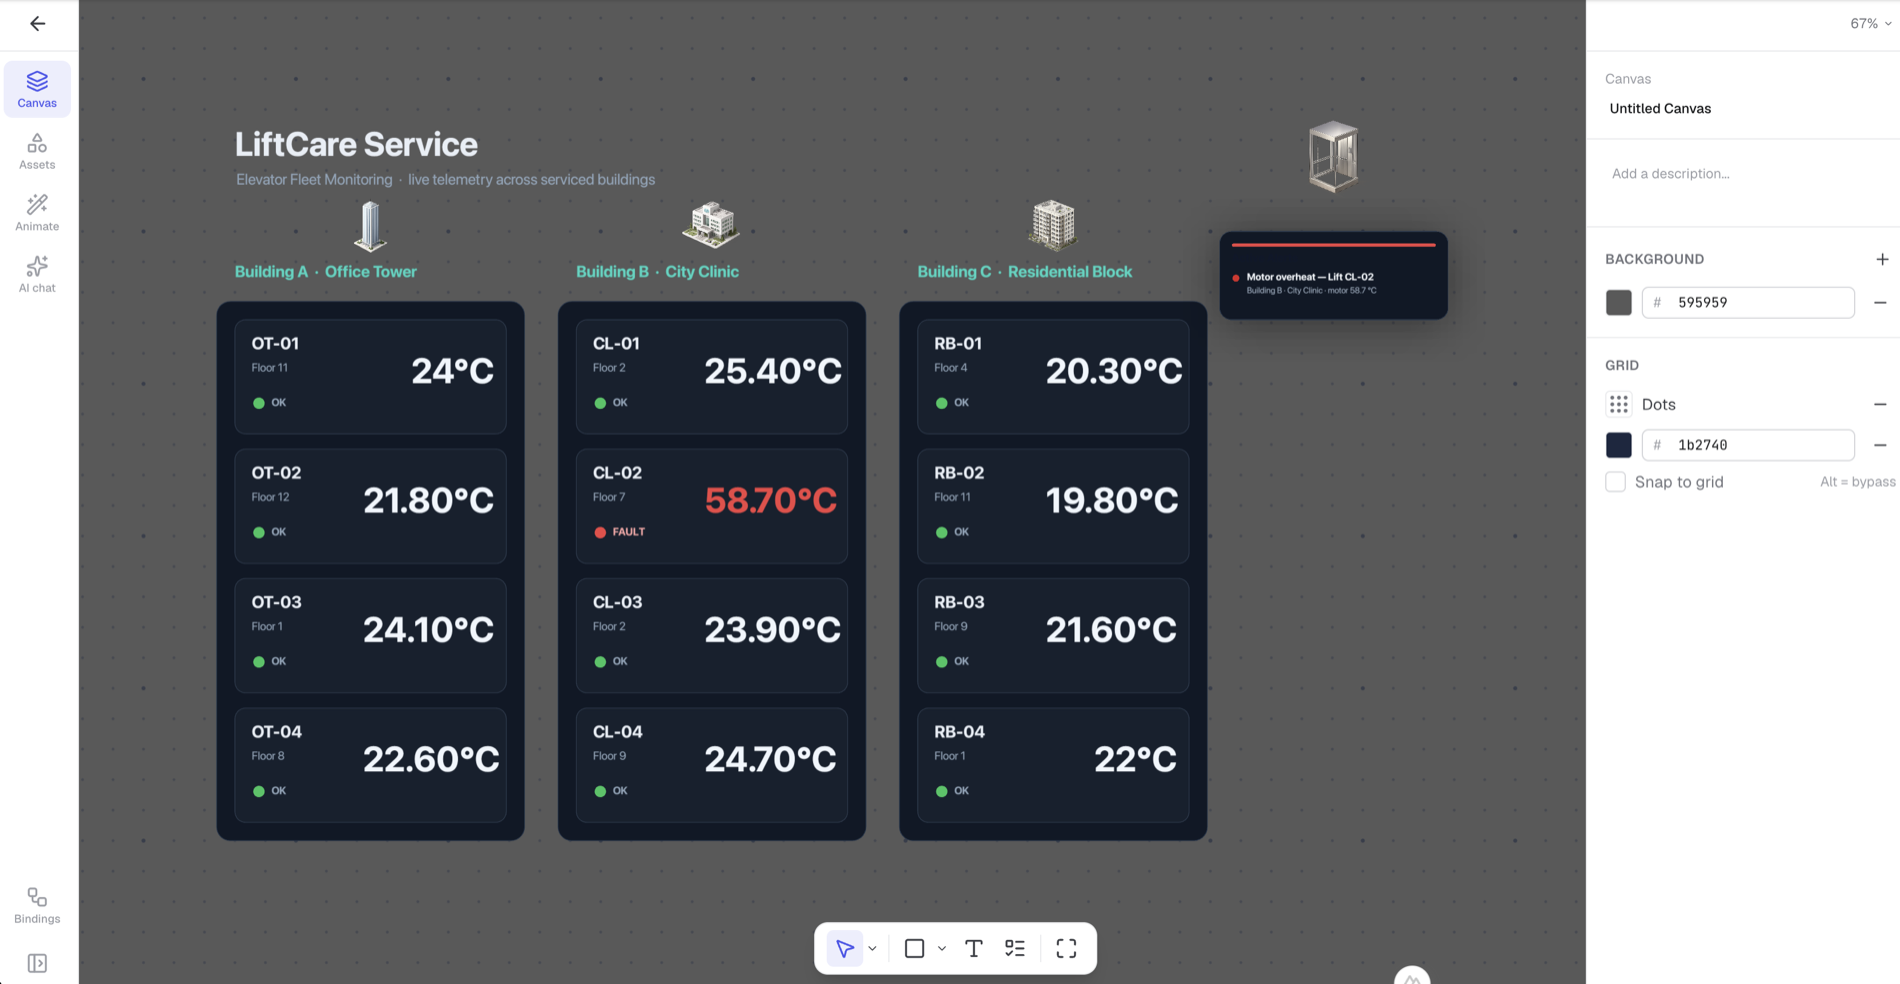
Map processes, objects and their dependencies intuitively — schematic or photo-based.
Track every status and value live, from any signal or event source.
Define rules that react and alert automatically on critical events.
Your team walks the floor, checks gauges, opens ten different systems. Nothing shows what’s actually happening across the whole operation at once.
They were built for IT engineers — dashboards full of numbers, graphs nobody reads. You need a picture of your operation, not another spreadsheet.
Because it shows the layout, the flow, the relationships. VisualThings™ does the same — except it’s live, connected to your real data, and updates the moment anything changes.
The approach
For decades, industrial control systems (SCADA) have run time-critical processes through vivid schematic pictures instead of tables of numbers. VisualThings™ lifts that principle to a universal level: the same intuitive real-time view — now for domains SCADA never reached.
VisualThings™ isn’t an industrial control system or a pure IoT platform — it brings their strongest concepts to where they were missing.
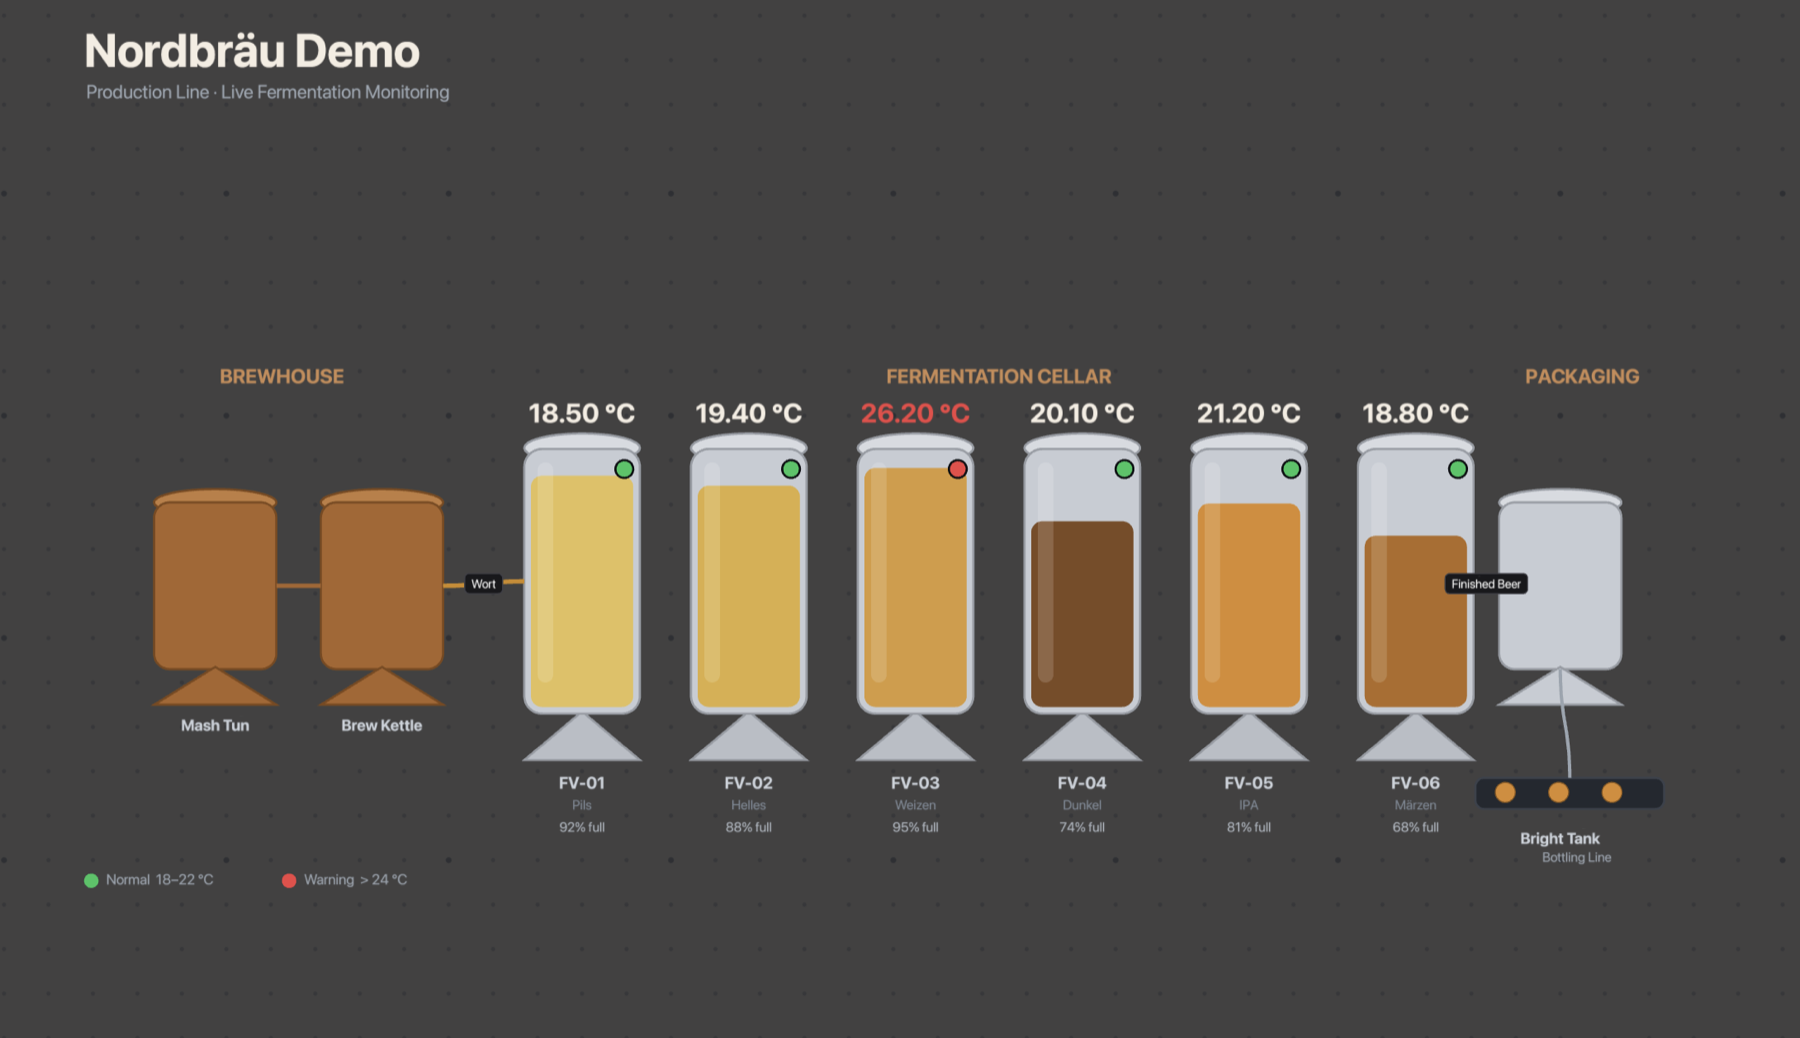
A living canvas of everything you run, connected to your real-time data. Every value updates and every status changes colour the moment it happens — so you see exactly what’s going on, object by object.
 app.visualthings.io/riverside-water-plant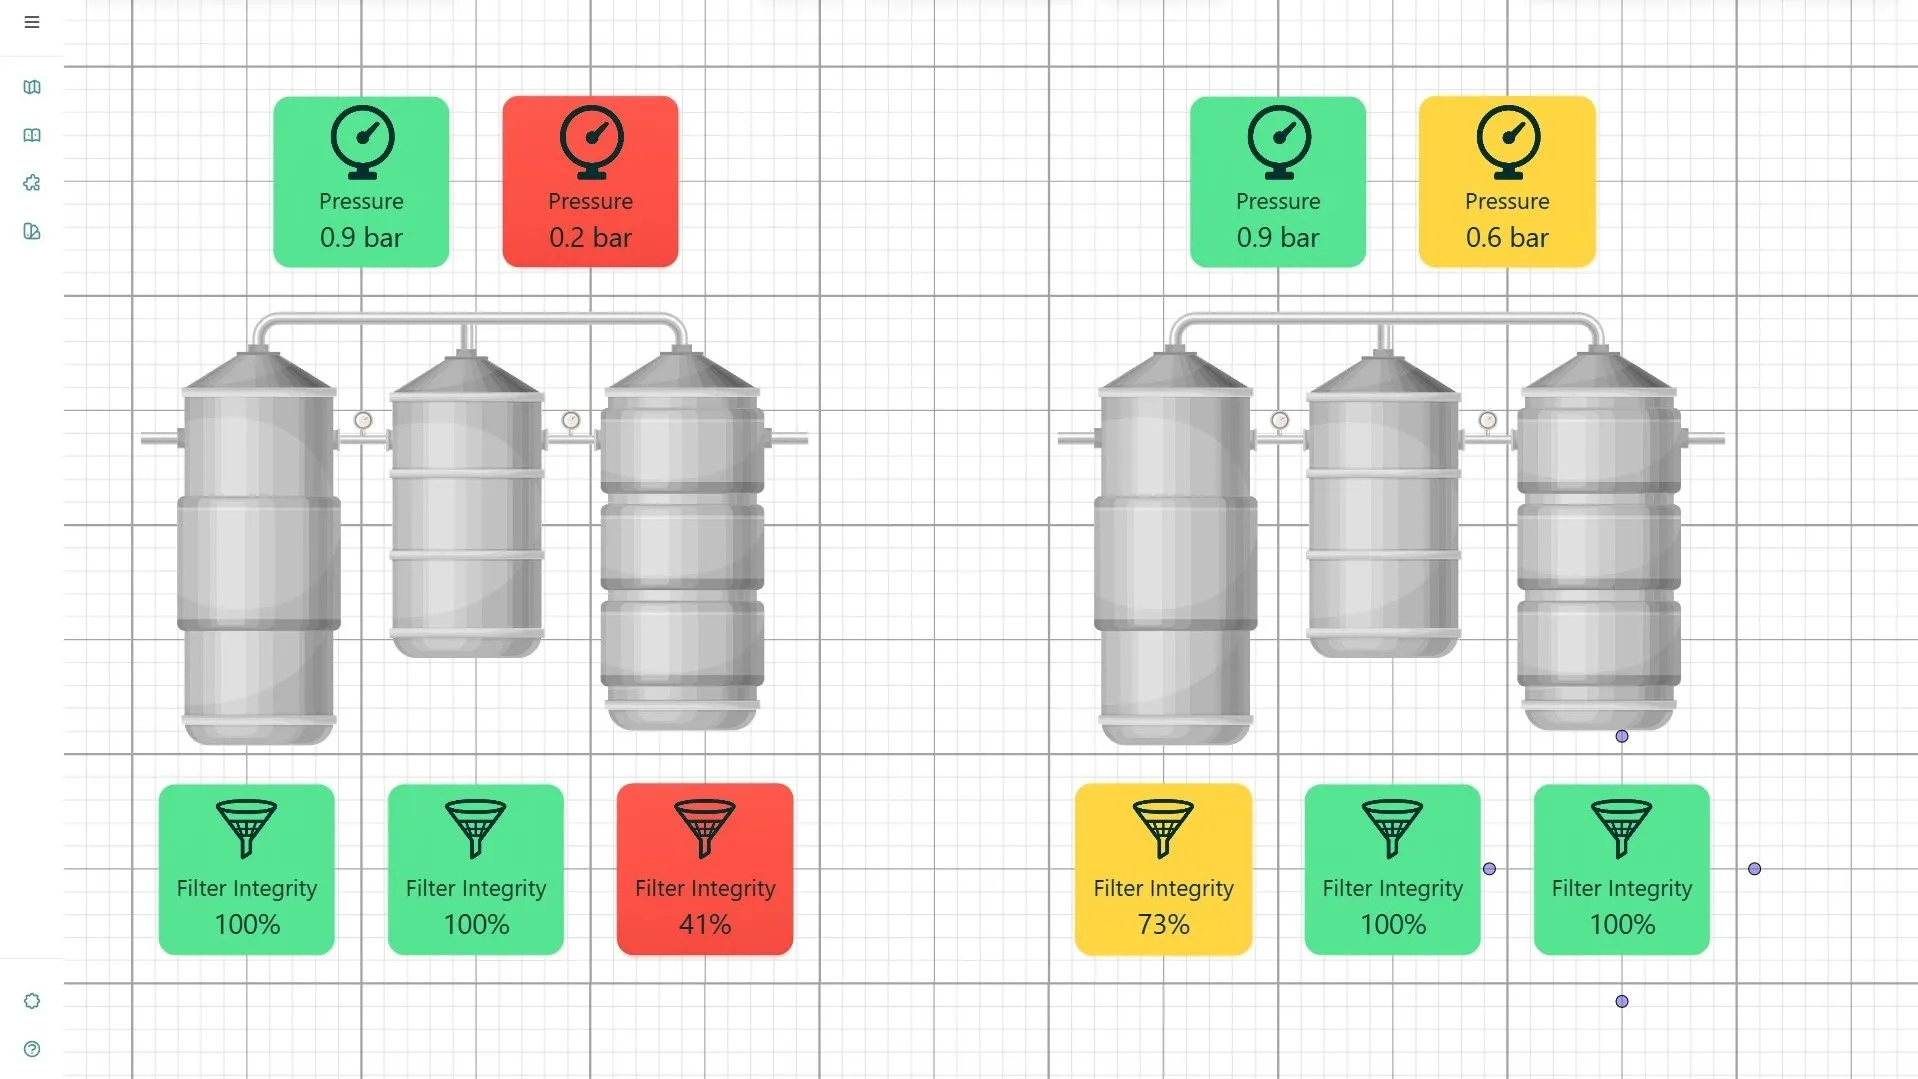
The same rules also watch whole fleets of autonomous AI agents — eventually, a human keeps the overview and full control.
Define thresholds and multi-signal conditions per object — your watch zones become visible right on the canvas.
The moment a rule trips, the object changes colour and an alert goes out — by email, SMS, or webhook.
Every signal and event stays tied to its object, so you can follow cause and effect — object by object, not lost in mass-data analytics.
Who it’s for?
Build your own monitoring and control view — as easily as in Miro®, MS PowerPoint® or Visio®. Connect your live data in a few clicks, with no costly specialists.
Run VisualThings™ as a wrapper over your existing SCADA, MES, ERP and legacy systems. Bring their signals and values together in one place — for a unified, high-level real-time view.
Your payoff
Grounded insight into the current state of your processes and objects, at any moment.
Spot deviations early and cut reaction and handling times sharply.
Avoid outages, cost spikes and wrong responses before they happen.
Act on reliable real-time ground truth instead of yesterday’s report.
Steadier processes, better output quality, end-to-end digitalization.
Streamlined operations and predictable costs through central monitoring and control.
A water plant, a wind farm, a brewery — even your greenhouse. Or your order management process, production logistics, or vehicle fleet - Whatever you run, you sketch it on the canvas and connect it to your live data. Same platform, shaped to your world.
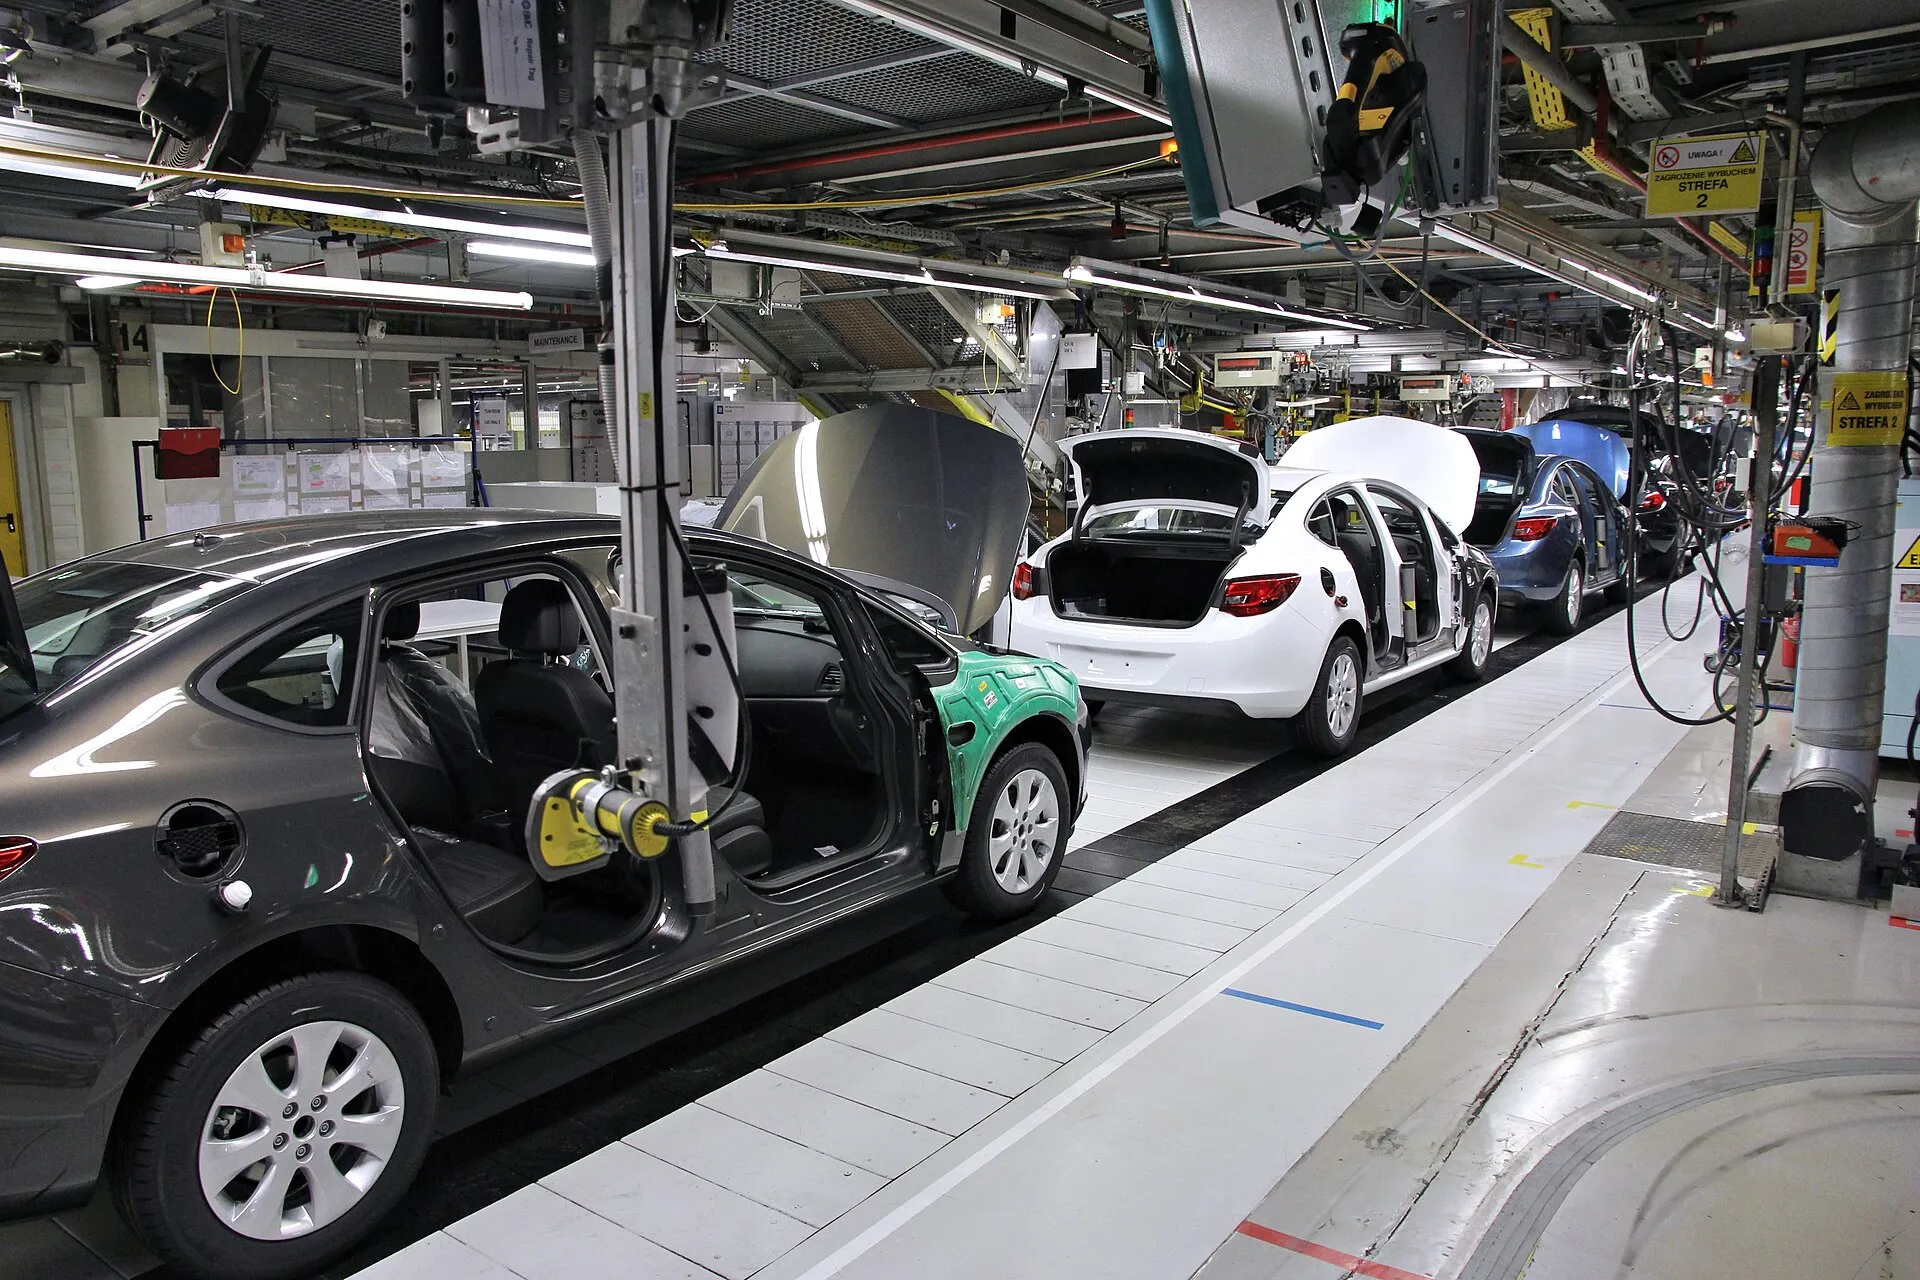
Stamping, welding, assembly, paint, QC — lay out the whole line, connect PLC data, and see bottlenecks the moment they form. Get alerted before downtime ever hits.
Lay out what you run, connect your data, and watch it come alive — ready for use in under 30 minutes.
Starting at€24.99/ month at launch
Engineered and hosted in Germany — your data stays in Europe, on our own infrastructure, with no cloud lock-in.