
Create living pictures
Draw a schematic or photo-based picture of your world on the canvas and bind any element to live data sources to bring it to life.
Features
VisualThings™ combines a powerful drawing editor, a live display panel, intuitive configuration and a built-in real-time database — so you can visualize, monitor and control your operations.
Two core capabilities
Draw a schematic or photo-based picture of your world on the canvas and bind any element to live data sources to bring it to life.
Set thresholds, conditions and responses — for monitoring, alerting and automatic follow-up actions in real time.
The building blocks
A graphical drawing editor built on modern practice — familiar as LucidChart®, MS PowerPoint® or Visio®. Images, icons, symbols, schematics: design freely.
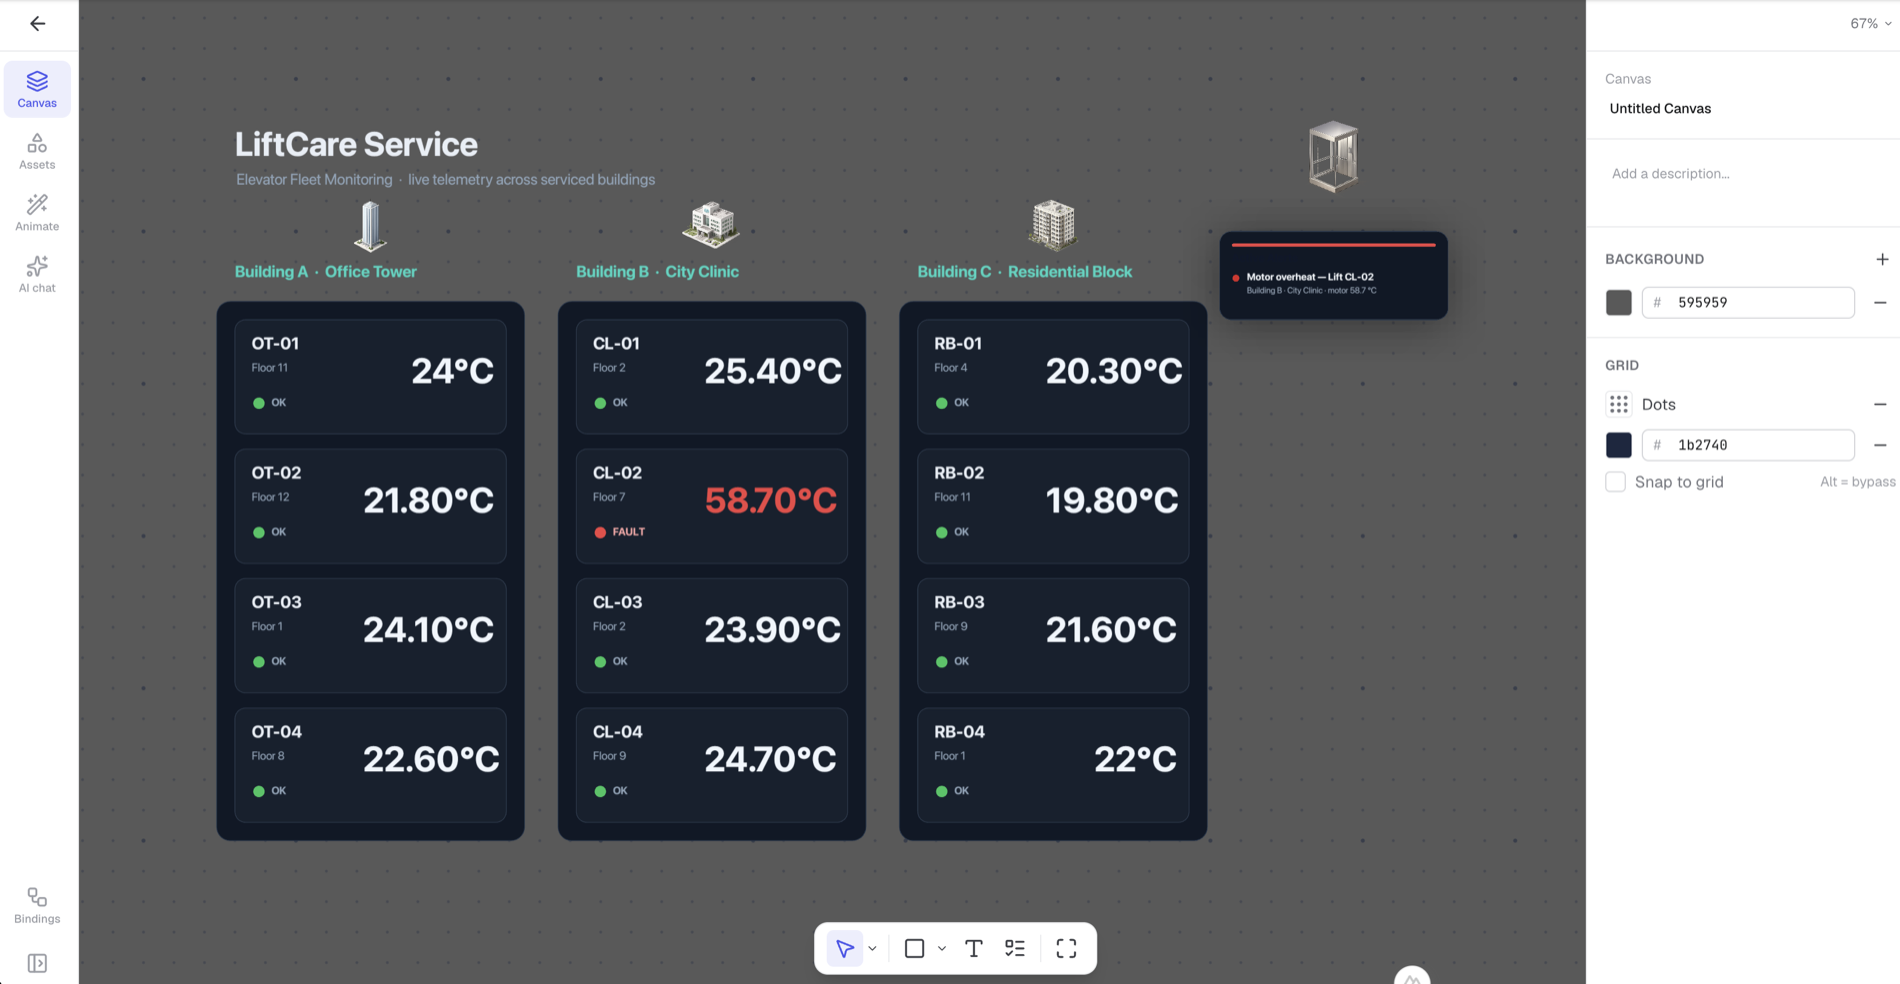
The live display panel: at runtime every relevant value is shown and updated in real time — symbolic, textual or numeric, exactly as you configured it.
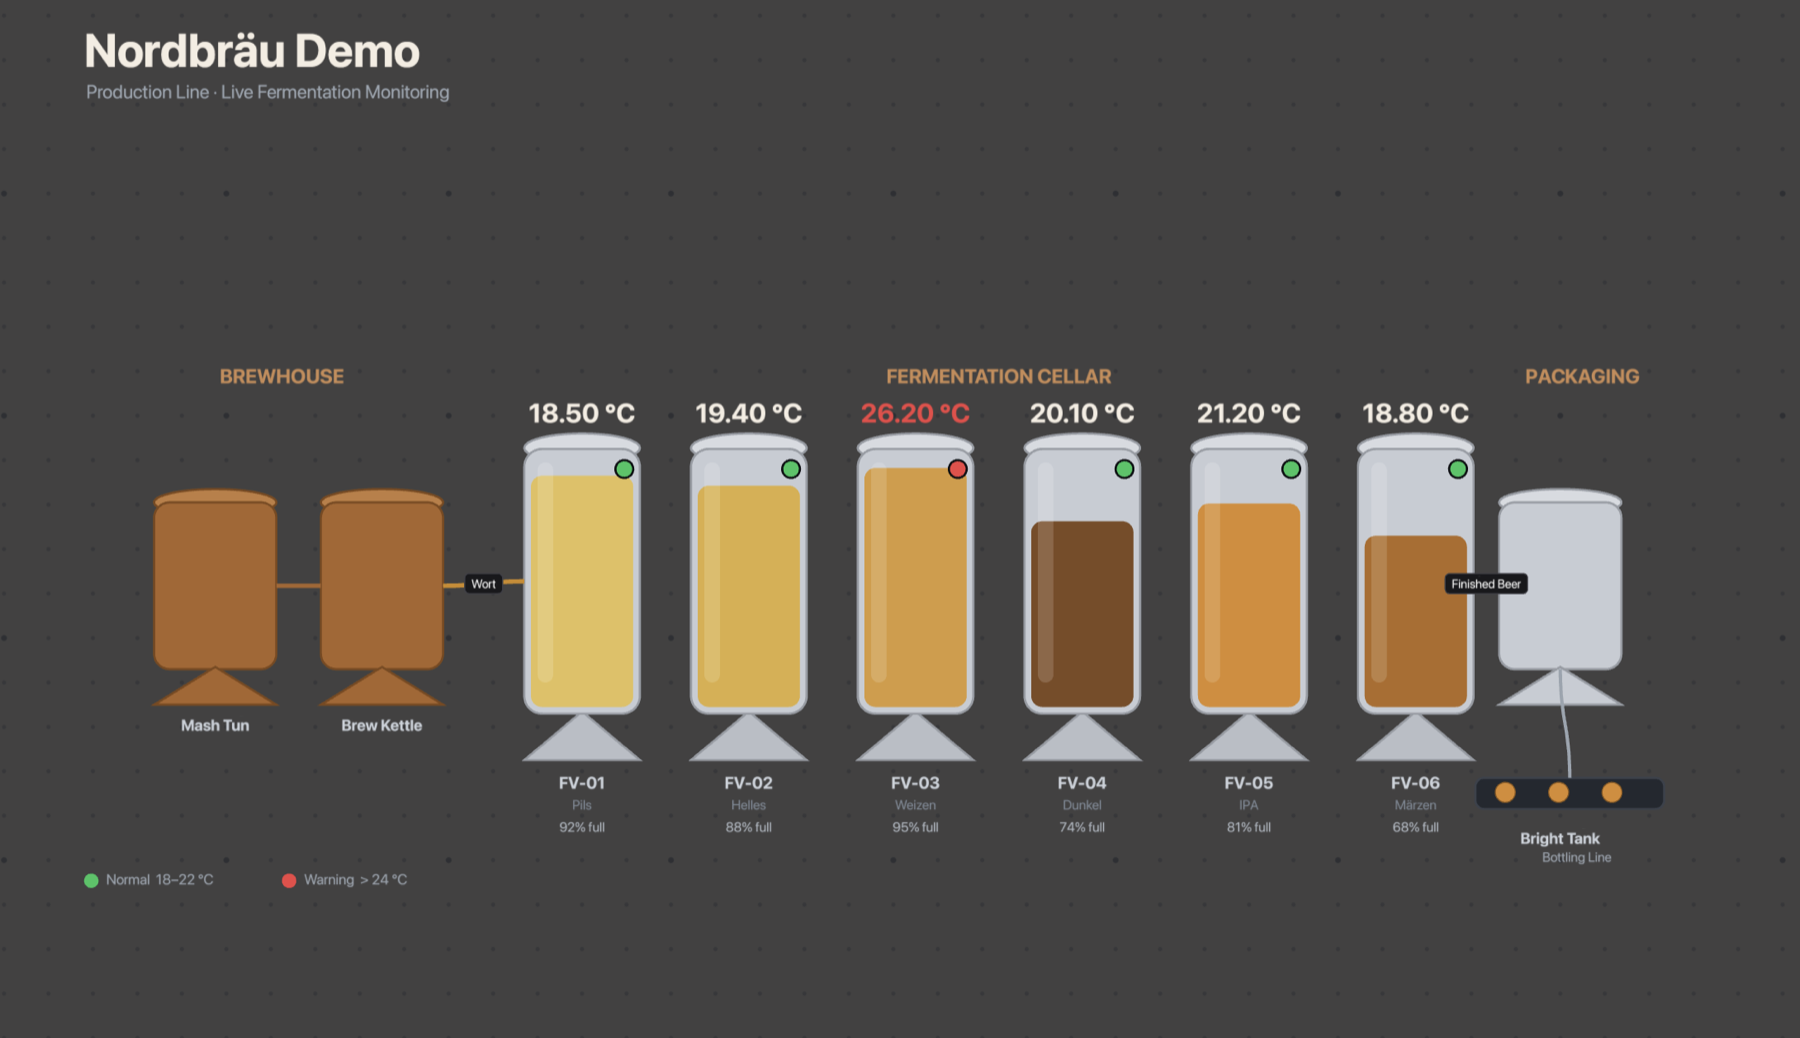
The intuitive configuration layer: link drawing elements to live data sources plus conditions and rules — in a few clicks, no specialists required.
A data pool for event data and signal values (measurements and time series). Or connect your existing event or time-series databases.
Characteristics
No install — reachable anywhere in the browser.
Signals and event messages are collected and made ready for display.
Every signal can be found, filtered and analyzed per source object.
Signals are processed, displayed and evaluated by rules, live.
AI monitoring
Autonomous AI agents run ever more process steps on their own. VisualThings™ makes their activity visible, lets you define allowed and disallowed behaviour with deviation corridors — across severity and criticality levels — and keeps a human in final control.
Signal & event sink
When needed, VisualThings™ acts as a permanent store for signal and event data — wherever the history of individual objects and occurrences is essential, not just aggregated statistics.
Lay out what you run, connect your data, and watch it come alive — ready for use in under 30 minutes.
Starting at€24.99/ month at launch
Engineered and hosted in Germany — your data stays in Europe, on our own infrastructure, with no cloud lock-in.